Institutional Insights: Goldman Sachs SP500 Positioning & Levels Update 10/9/11

SYSTEMATIC SUPPLY BIAS SITS DIRECTLY AGAINST ACCELERATING CORPORATE ABSORPTION.
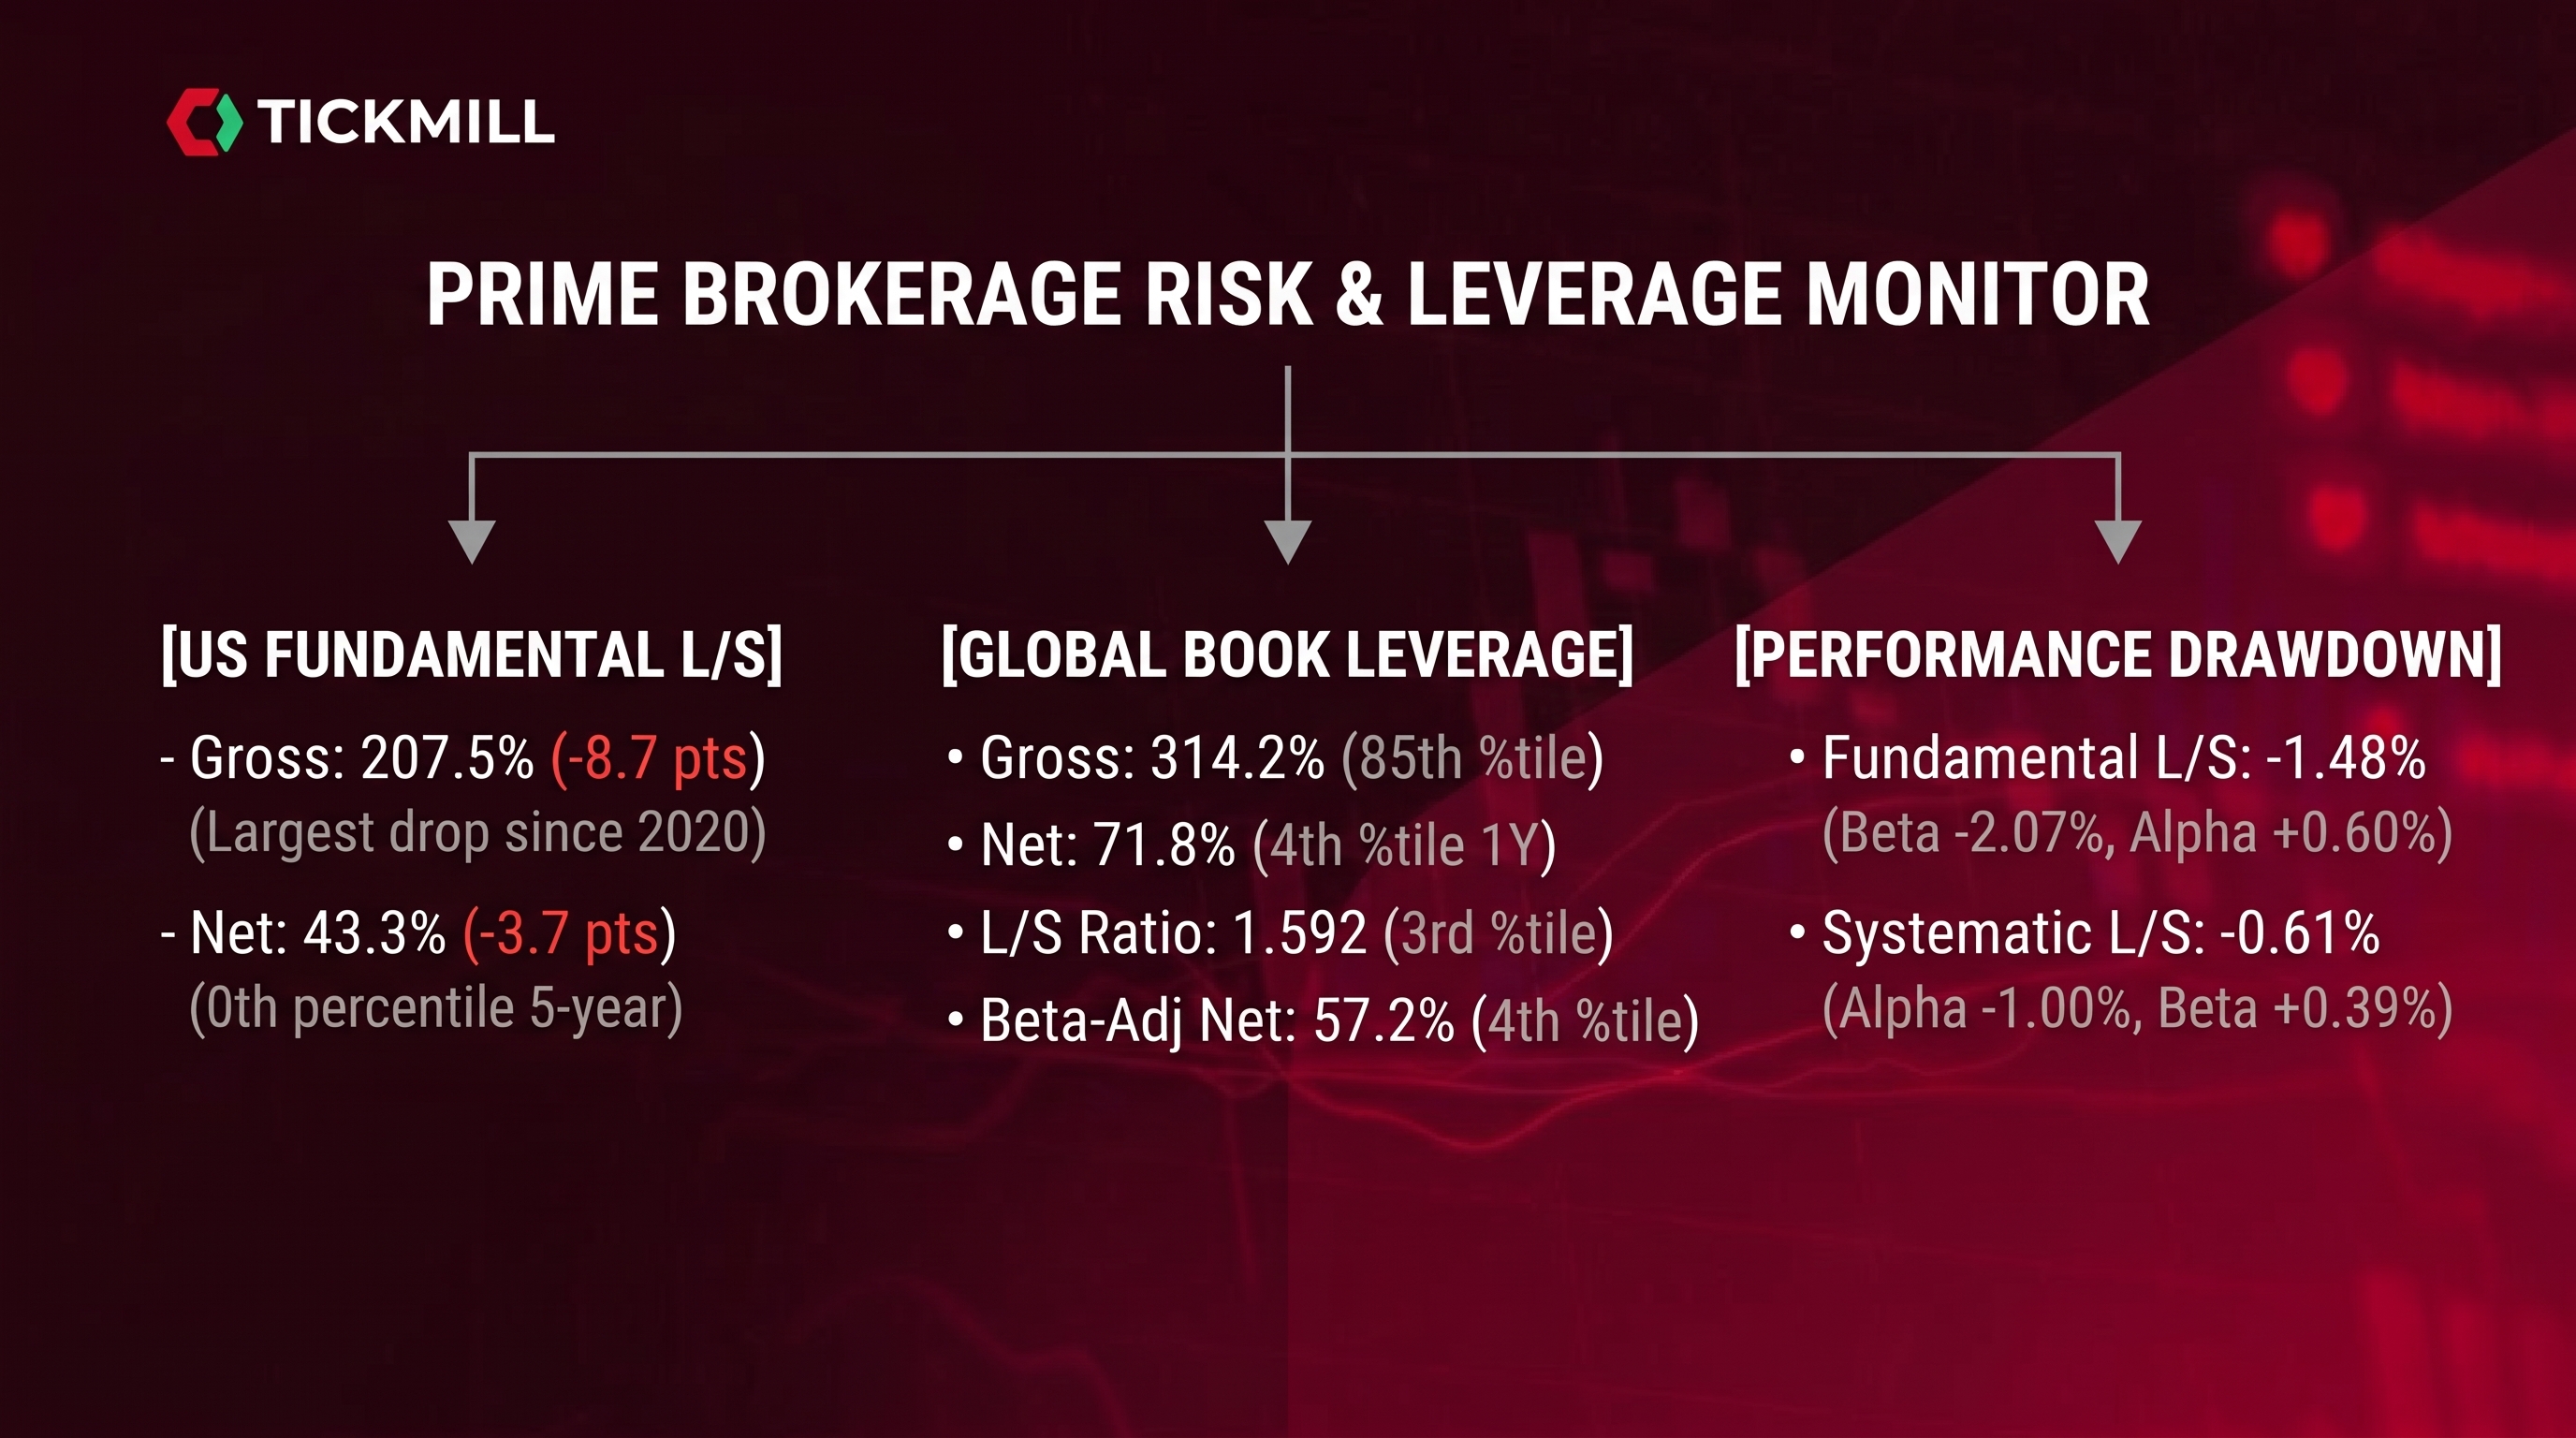
Goldman Sachs positioning and execution desks reveal a market navigating an acute structural tug-of-war. Fundamental Long/Short net leverage has cratered into historic single-digit percentiles—with US Fundamental L/S Net leverage touching 43.3% (0th percentile over 5 years) and global tech equity net selling matching the largest weekly liquidations on record.
This severe de-grossing and de-risking backdrop leaves market microstructure driven by two opposing systematic and programmatic flows:
The CTA Selling Overhang: In North America alone, CTA baseline model flows project -$36B of equity selling over the next week (flat tape models -$31.1B out of SPX; down tape models -$31.5B out of SPX; up tape still models -$23.1B of SPX supply). Futures closed Monday at 7,549, resting directly on the knife-edge of the 7,549 medium-term CTA pivot.
The Corporate Buyback Bid: Absorbing this systematic de-risking is a surging corporate repurchase engine. Desks logged a decisive shift toward discretionary open-market buying (rising to 33% of execution volume vs. 67% 10b5-1 programs) as 90% of the S&P 500 exited earnings blackout windows (reaching ~93% by Friday). Backed by record YTD authorizations of $1.50T (surpassing full-year 2025's $1.37T), corporate daily VWAP demand is operating at 1.6x–1.7x multi-year ADTV baselines to buffer top-down supply.
CTA SYSTEMATIC FLOW MATRIX & SPX THRESHOLD LEVELS
Simulated CTA equity flows (based on 1x SD moves of 1.62% in 1-week and 3.78% in 1-month) show that systematic trend followers remain net sellers across nearly all near-term paths, with S&P 500 contracts bearing the brunt of the models' liquidations:
1-Week Simulated CTA Matrix:
Flat Tape: -$23.3B to SELL globally (including -$31.1B out of SPX)
Up Tape (+1.62%): -$3.9B to SELL globally (including -$23.1B out of SPX)
Down Tape (-1.62%): -$48.7B to SELL globally (including -$31.5B out of SPX)
1-Month Simulated CTA Matrix:
Flat Tape: -$45.7B to SELL globally (including -$41.1B out of SPX)
Up Tape (+3.78%): +$74.0B to BUY globally (+$14.4B into SPX)
Down Tape (-3.78%): -$149.5B to SELL globally (including -$45.4B out of SPX)
S&P 500 Systematic Pivot Levels:
Short-Term Pivot: 7,676 (Requires a +1.68% push to clear)
Medium-Term Pivot: 7,549 (Monday's cash close of 7,549.00 sits precisely at this structural threshold)
Long-Term Floor: 7,084 (Macro trend boundary)
PRIME BROKERAGE: HISTORIC LEVERAGE UNWINDS & RECORD TECH SELLING
De-Grossing Intensity: Global equities were net sold (-1.0 SDs 1-year) as de-grossing accelerated to -$0.8 SDs 1-year (the largest dollar de-grossing since July), driven by long selling outpacing short covers 5 to 1.
US Fundamental Risk Offloading:
US Fundamental L/S Gross leverage dropped -8.7 pts to 207.5%—the steepest single-week gross contraction since the March 2020 pandemic onset.
US Fundamental L/S Net leverage slid -3.7 pts to 43.3%—the largest weekly net drop since Liberation Day (April 2025), locking positioning at the absolute 0th percentile over 5 years.
Single Stocks vs. Macro Wrappers: US single stocks saw their heaviest net selling in over 4 months (-2.1 SDs 1-year; long-and-short sales 3.8:1). In contrast, Macro Products were net bought (+1.5 SDs 1-year), though Thursday (Nov 5) saw US-listed ETF short interest jump +7.0% (the 3rd largest single-day short increase in 5 years).
Sector Decomposition:
Information Technology: Heaviest dollar net-sold sector across every global region (sales outpacing buys 2.2:1). Net selling matched all-time record weeks (mid-Oct 2026 and Sep 2024); 4 of the top 5 net selling weeks in global Tech history have occurred within the past 5 months.
Industrials: Second-most net-sold sector globally; experienced its largest percentage net selling in over 5 years (led by Electrical Equipment, Building Products, and Aerospace & Defense; Machinery and Airlines bucked the trend).
Net Inflows: Concentrated defensively into Utilities, Real Estate, and Financials.
BUYBACK DESK EXECUTION: ACCELERATING OPEN-MARKET BID
Execution Volume Surge: Desk activity reached 1.6x vs. 2025 YTD ADTV and 1.7x vs. 2024 YTD ADTV, concentrated in Industrials, Financials, and Energy.
Pivot to Discretionary Execution: Open-market opportunistic orders rose from 22% to 33% of desk flow (with 10b5-1 scheduled volume at 67%), demonstrating management willingness to exploit the post-election pullback.
Corporate Authorization Firepower: 2026 YTD corporate authorizations stand at $1.50 trillion, pacing ahead of 2025’s full-year aggregate ($1.37T) and entering peak November seasonality with ~93% of the S&P 500 open for execution by Friday.
CHARTS & THEMATIC METRICS IN FOCUS
US Panic Index & Risk Appetite Indicator (RAI): Tracking volatility normalization following the VVIX drop and the Vol Panic Index printing 9.3/10 during Thursday's liquidation.
Skew Dynamics: SPX vs. Singles skew and Call vs. Put skew steepness, capturing heavy demand for downside replacement structures and subsequent monetization into call spreads.
Futures Liquidity & Correlation: S&P futures top-of-book market depth, S&P 500 implied correlation, and the NDX vs. SPX implied volatility spread heading into Tuesday's CPI release.
Disclaimer: The material provided is for information purposes only and should not be considered as investment advice. The views, information, or opinions expressed in the text belong solely to the author, and not to the author’s employer, organization, committee or other group or individual or company.
Past performance is not indicative of future results.
High Risk Warning: CFDs are complex instruments and come with a high risk of losing money rapidly due to leverage. 68% and 74% of retail investor accounts lose money when trading CFDs with Tickmill UK Ltd and Tickmill Europe Ltd respectively. You should consider whether you understand how CFDs work and whether you can afford to take the high risk of losing your money.
Futures and Options: Trading futures and options on margin carries a high degree of risk and may result in losses exceeding your initial investment. These products are not suitable for all investors. Ensure you fully understand the risks and take appropriate care to manage your risk.
Patrick has been involved in the financial markets for well over a decade as a self-educated professional trader and money manager. Flitting between the roles of market commentator, analyst and mentor, Patrick has improved the technical skills and psychological stance of literally hundreds of traders – coaching them to become savvy market operators!